Potable Water
Rated: Good
Canadians expect their tap water to be safe to drink. As a result, municipalities invest in water treatment plants, water pumping stations, water reservoirs and distribution and transmission pipes.
The potable water infrastructure assets in our survey included the linear portion of drinking water systems (i.e., local water and transmission pipes) and non-linear assets (i.e., water treatment facilities, water pumping stations, water reservoirs). Linear water infrastructure is classified into local water pipes—known as distribution pipes—and transmission pipes.
The current state
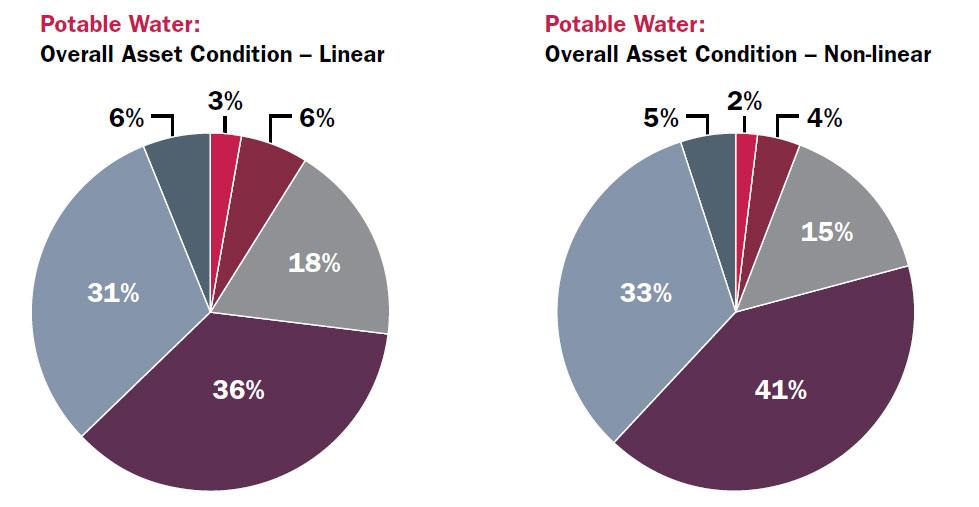
Overall, approximately 30% of potable water infrastructure is in very good condition, 40% is in good condition and 25% is in fair, poor or very poor condition. Approximately 30-40% of these assets were constructed in the last 20 years.
We assessed these assets using a defined scale and their age profile.
- Watermains have an ESL of 70-100 years depending on the material.
- Vertical facilities have an ESL of 50-80 years for structural components, 25 years for mechanical and electrical components.
Potable water by the numbers